Matrix diagram: definition and example
A matrix diagram is a table-like diagram that arranges topics in rows and columns, so each cell holds the item that sits where a row and a column meet.
What it means
Rows and columns give each cell two coordinates. That makes a matrix good for comparing: options against criteria, tasks against people, or four boxes of a framework.
When to use one
Use it when your content has two dimensions and you want to scan both, such as a comparison of three tools across five features.
How it differs from nearby terms
A mind map has one centre and branches, so each item has one parent. A matrix has no parent; the position is the meaning. A fishbone diagram has a fixed head-and-bones shape for causes.
In MindmapPal
The MindmapPal app for iPhone and iPad has grid and matrix structures, and each cell holds topics. In the web editor, the SWOT template opens as a grid of four squares.
Example
A SWOT analysis is a matrix with Strengths, Weaknesses, Opportunities and Threats as four cells. Each cell lists the points for one quadrant.
Related terms
- Fishbone diagram: A fishbone diagram is a cause-and-effect diagram that puts a problem at the head of a fish skeleton and groups its possible causes on bones branching from a central spine.
- Timeline diagram: A timeline diagram is a diagram that places events, phases or milestones along a line in the order they happen, with details attached to each point.
- Mind map: A mind map is a diagram that puts one idea in the centre and arranges related ideas around it as branches, with the details of each branch nested under it.
- Logic chart: A logic chart is a mind map structure in which the central topic sits at one side and every branch extends in a single direction, so the map reads from left to right or right to left.
See it in a template
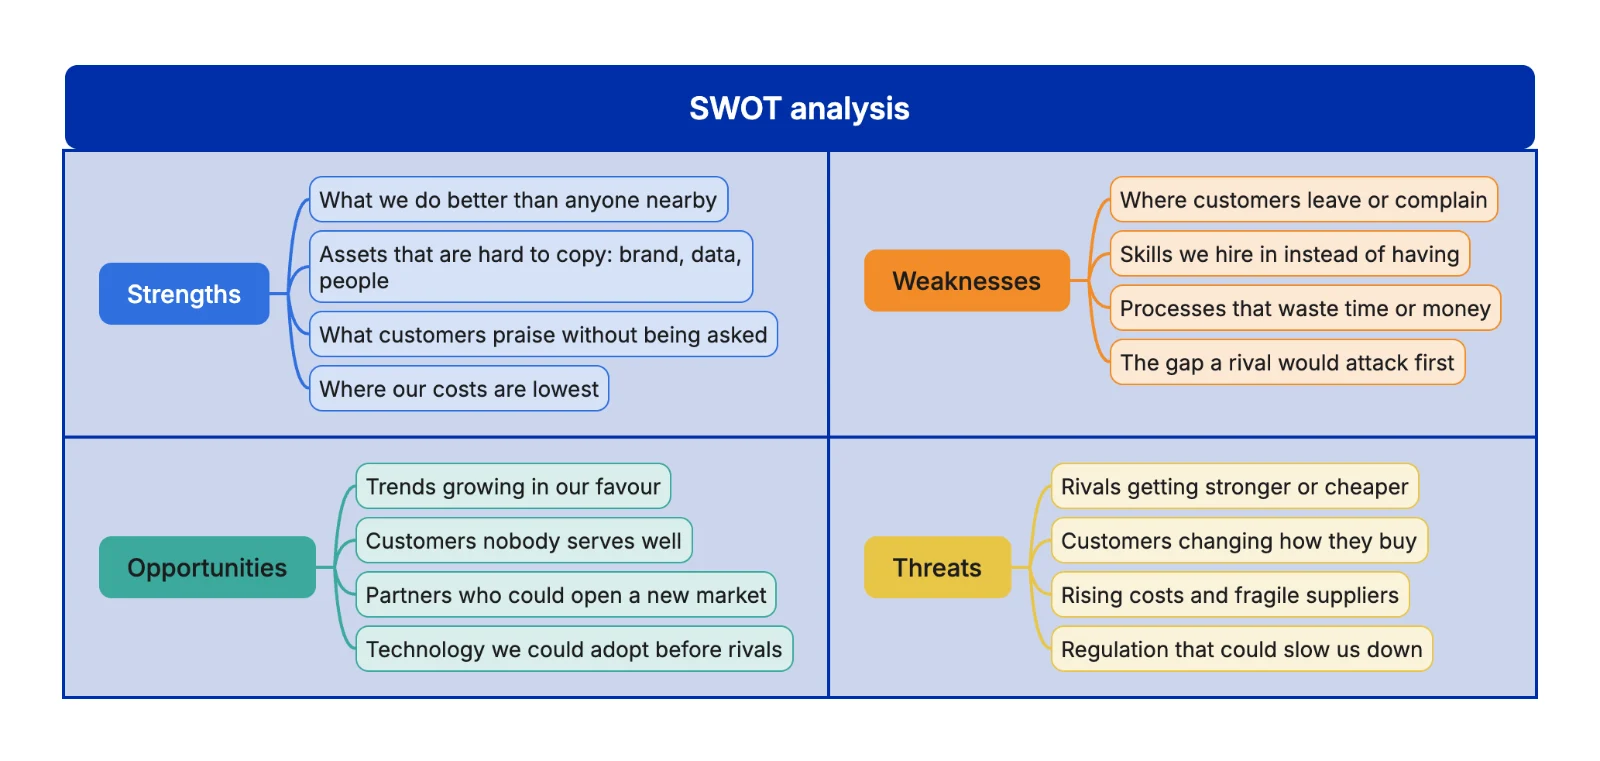 SWOT analysis mind map template